Code
import pandas as pd
import numpy as np
import matplotlib.pyplot as plt
import seaborn as sns
from matplotlib.pyplot import legend
import pandas as pd
import numpy as np
import matplotlib.pyplot as plt
import seaborn as sns
from matplotlib.pyplot import legend
# Load PER and TS% dataset and display the first few rows
df_per_ts = pd.read_csv("../data/PER-TS%.csv")
print(df_per_ts.head())

# Boxplot: Player Efficiency Rating (PER) by Season
plt.figure(figsize=(10, 6))
sns.boxplot(y=df_per_ts['PER'], x=df_per_ts['Season'])
plt.grid(True)
plt.title("PER Distribution by Season")
plt.show()

# Load seasonal player data from 2019 to 2022
df_19 = pd.read_csv("../data/merged_data_pos-2019.csv")
df_20 = pd.read_csv("../data/merged_data_pos-2020.csv")
df_21 = pd.read_csv("../data/merged_data_pos-2021.csv")
df_22 = pd.read_csv("../data/merged_data_pos-2022.csv")

# Add season labels
df_19['season'] = "2019-20"
df_20['season'] = "2020-21"
df_21['season'] = "2021-22"
df_22['season'] = "2022-23"

# Combine PTS and Season into a single dataframe for KDE plot
df_all_seasons = pd.concat([
    df_19[['pts', 'season']],
    df_20[['pts', 'season']],
    df_21[['pts', 'season']],
    df_22[['pts', 'season']]
], ignore_index=True)

print(df_all_seasons)
   Season         Player   PER    TS%
0    2019   Bradley Beal  20.8  0.581
1    2019   James Harden  30.6  0.616
2    2019   Kemba Walker  21.7  0.558
3    2019  Tobias Harris  17.2  0.592
4    2019  Tobias Harris  18.2  0.605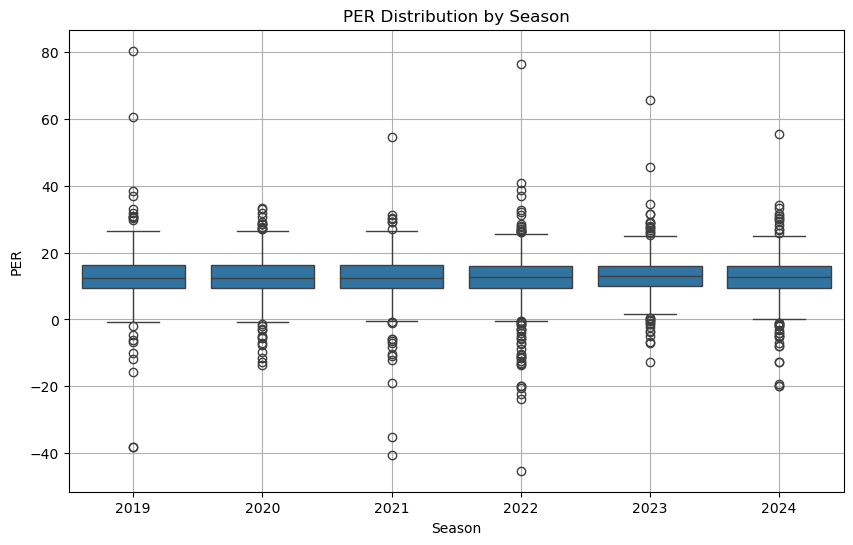
       pts   season
0     14.4  2019-20
1      9.5  2019-20
2      6.3  2019-20
3     11.9  2019-20
4      4.3  2019-20
...    ...      ...
1826   5.6  2022-23
1827  11.6  2022-23
1828  24.8  2022-23
1829   5.2  2022-23
1830   5.7  2022-23

[1831 rows x 2 columns]# KDE plot: Distribution of Points per Game across seasons
plt.figure(figsize=(10, 6))
sns.kdeplot(data=df_all_seasons, x='pts', hue='season', fill=True, common_norm=False, alpha=0.4)
plt.xlabel("Average Points Per Game (PTS)", fontsize=12)
plt.ylabel("Density", fontsize=12)
plt.legend(title='Season')
plt.grid(True)
plt.title("Scoring Distribution by Season")
plt.show()
C:\Users\27508\AppData\Local\Temp\ipykernel_23776\2875802610.py:6: UserWarning: No artists with labels found to put in legend.  Note that artists whose label start with an underscore are ignored when legend() is called with no argument.
  plt.legend(title='Season')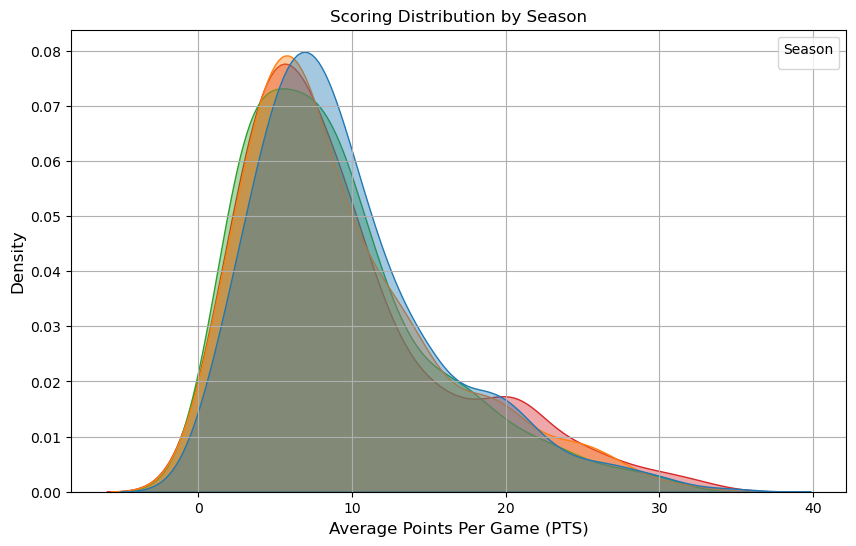
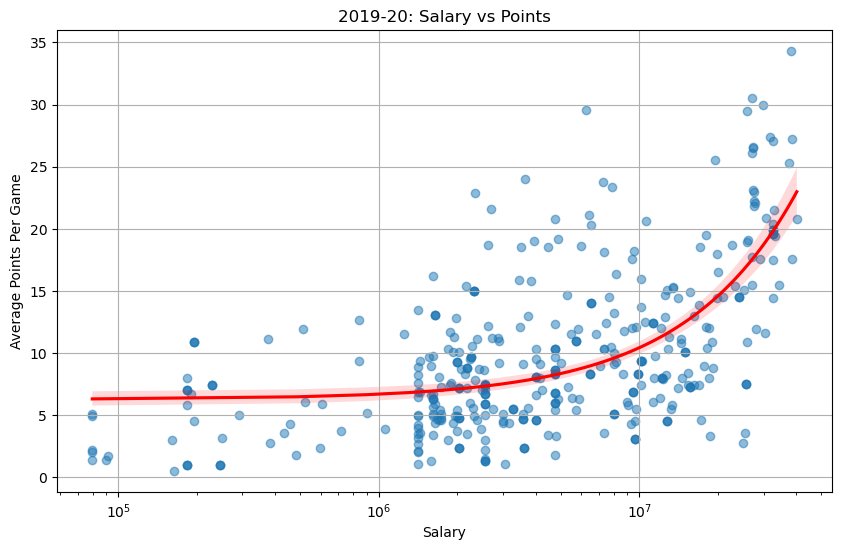
# Scatter + Regression plots for Salary vs Points (each season)
# 2019-20
plt.figure(figsize=(10, 6))
sns.regplot(data=df_19, x='season.y', y='pts', scatter_kws={'alpha': 0.5}, line_kws={"color": "red"})
plt.xscale("log")
plt.xlabel("Salary")
plt.ylabel("Average Points Per Game")
plt.title("2019-20: Salary vs Points")
plt.grid(True)
plt.show()
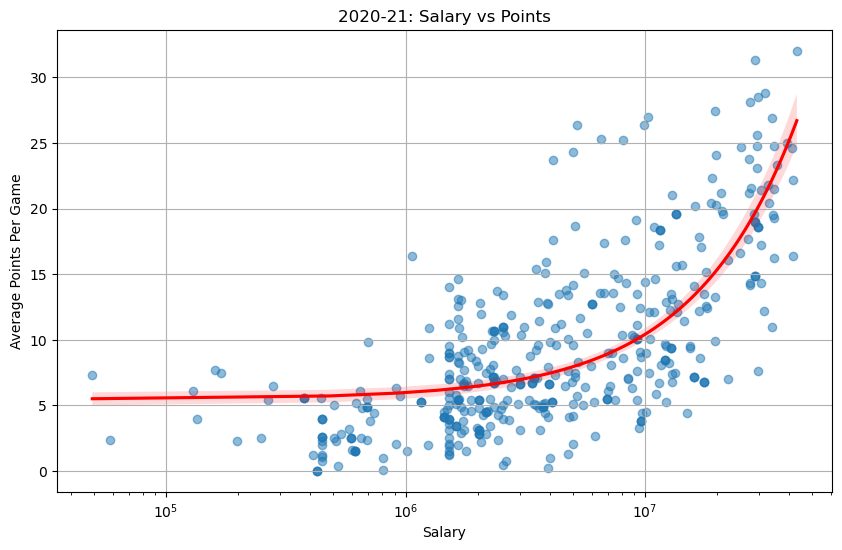
# 2020-21
plt.figure(figsize=(10, 6))
sns.regplot(data=df_20, x='2020/21', y='pts', scatter_kws={'alpha': 0.5}, line_kws={"color": "red"})
plt.xscale("log")
plt.xlabel("Salary")
plt.ylabel("Average Points Per Game")
plt.title("2020-21: Salary vs Points")
plt.grid(True)
plt.show()
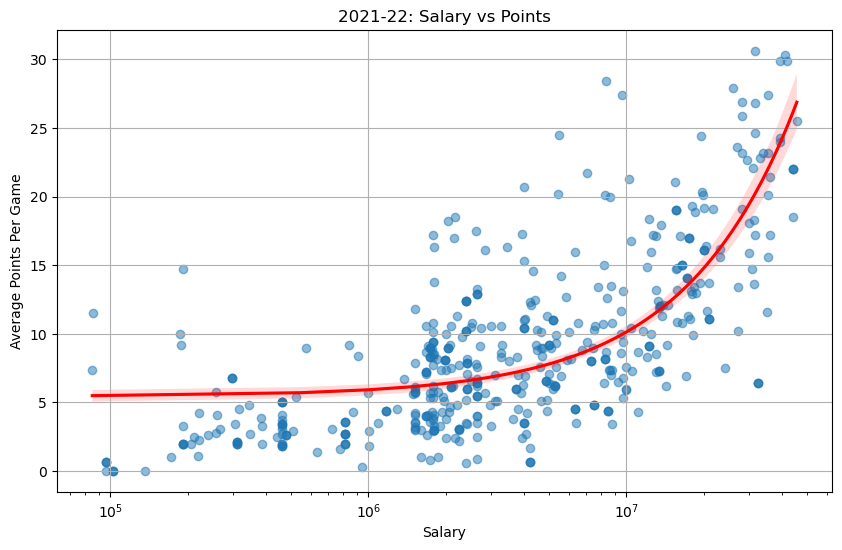
# 2021-22
plt.figure(figsize=(10, 6))
sns.regplot(data=df_21, x='2021/22', y='pts', scatter_kws={'alpha': 0.5}, line_kws={"color": "red"})
plt.xscale("log")
plt.xlabel("Salary")
plt.ylabel("Average Points Per Game")
plt.title("2021-22: Salary vs Points")
plt.grid(True)
plt.show()
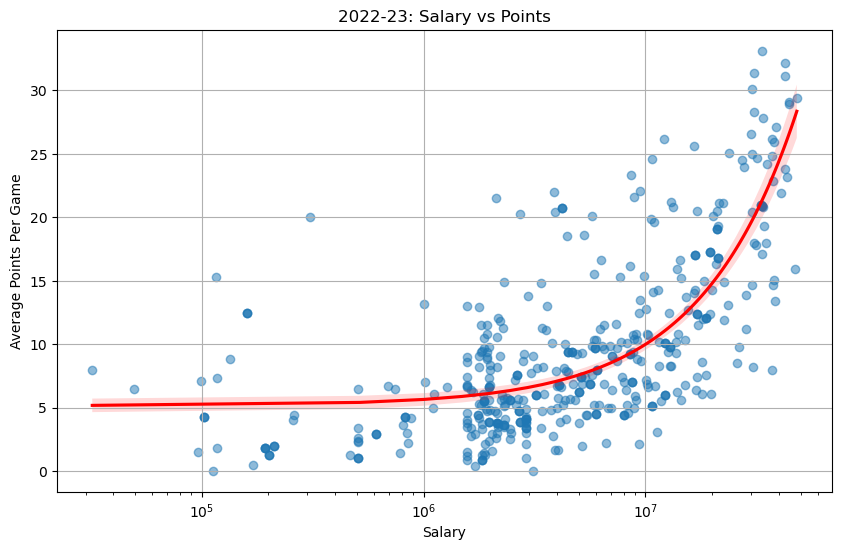
# 2022-23
plt.figure(figsize=(10, 6))
sns.regplot(data=df_22, x='2022/23', y='pts', scatter_kws={'alpha': 0.5}, line_kws={"color": "red"})
plt.xscale("log")
plt.xlabel("Salary")
plt.ylabel("Average Points Per Game")
plt.title("2022-23: Salary vs Points")
plt.grid(True)
plt.show()
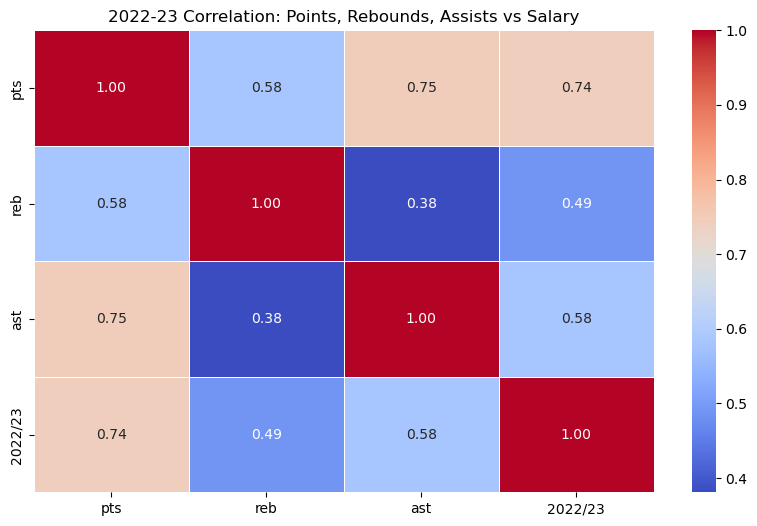
# Correlation heatmaps for each season
# 2022
plt.figure(figsize=(10, 6))
corr_matrix_22 = df_22[["pts", "reb", "ast", "2022/23"]].corr()
sns.heatmap(corr_matrix_22, annot=True, cmap='coolwarm', fmt=".2f", linewidths=0.5)
plt.title("2022-23 Correlation: Points, Rebounds, Assists vs Salary")
plt.show()
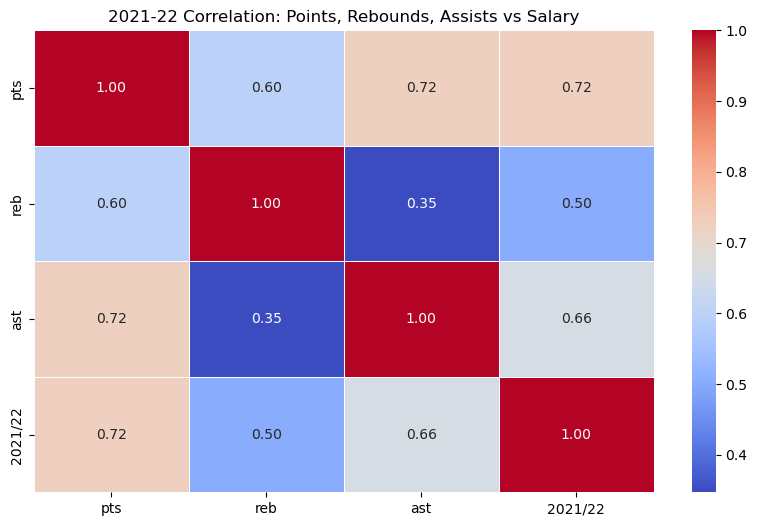
# 2021
plt.figure(figsize=(10, 6))
corr_matrix_21 = df_21[["pts", "reb", "ast", "2021/22"]].corr()
sns.heatmap(corr_matrix_21, annot=True, cmap='coolwarm', fmt=".2f", linewidths=0.5)
plt.title("2021-22 Correlation: Points, Rebounds, Assists vs Salary")
plt.show()
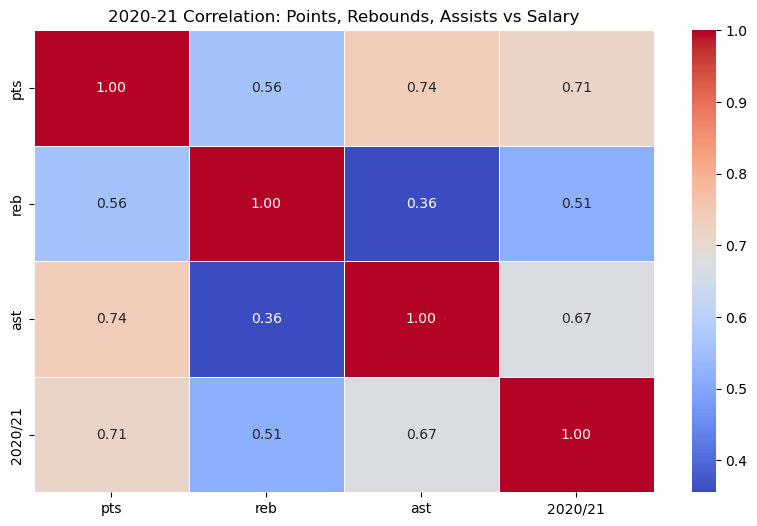
# 2020
plt.figure(figsize=(10, 6))
corr_matrix_20 = df_20[["pts", "reb", "ast", "2020/21"]].corr()
sns.heatmap(corr_matrix_20, annot=True, cmap='coolwarm', fmt=".2f", linewidths=0.5)
plt.title("2020-21 Correlation: Points, Rebounds, Assists vs Salary")
plt.show()
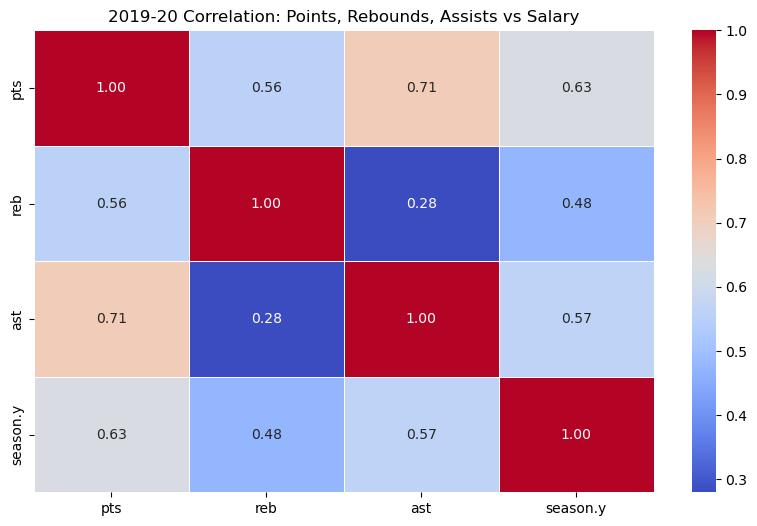
# 2019
plt.figure(figsize=(10, 6))
corr_matrix_19 = df_19[["pts", "reb", "ast", "season.y"]].corr()
sns.heatmap(corr_matrix_19, annot=True, cmap='coolwarm', fmt=".2f", linewidths=0.5)
plt.title("2019-20 Correlation: Points, Rebounds, Assists vs Salary")
plt.show()
# Boxplots of performance metrics by player position for each season

# 2019
plt.figure(figsize=(15, 5))
plt.subplot(1, 3, 1)
sns.boxplot(data=df_19, x="Pos", y="pts", palette="Blues")
plt.title("2019-20: Position vs PTS")
plt.subplot(1, 3, 2)
sns.boxplot(data=df_19, x="Pos", y="reb", palette="Greens")
plt.title("2019-20: Position vs REB")
plt.subplot(1, 3, 3)
sns.boxplot(data=df_19, x="Pos", y="ast", palette="Reds")
plt.title("2019-20: Position vs AST")
plt.tight_layout()
plt.show()

# 2020
plt.figure(figsize=(15, 5))
plt.subplot(1, 3, 1)
sns.boxplot(data=df_20, x="Pos", y="pts", palette="Blues")
plt.title("2020-21: Position vs PTS")
plt.subplot(1, 3, 2)
sns.boxplot(data=df_20, x="Pos", y="reb", palette="Greens")
plt.title("2020-21: Position vs REB")
plt.subplot(1, 3, 3)
sns.boxplot(data=df_20, x="Pos", y="ast", palette="Reds")
plt.title("2020-21: Position vs AST")
plt.tight_layout()
plt.show()

# 2021
plt.figure(figsize=(15, 5))
plt.subplot(1, 3, 1)
sns.boxplot(data=df_21, x="Pos", y="pts", palette="Blues")
plt.title("2021-22: Position vs PTS")
plt.subplot(1, 3, 2)
sns.boxplot(data=df_21, x="Pos", y="reb", palette="Greens")
plt.title("2021-22: Position vs REB")
plt.subplot(1, 3, 3)
sns.boxplot(data=df_21, x="Pos", y="ast", palette="Reds")
plt.title("2021-22: Position vs AST")
plt.tight_layout()
plt.show()

# 2022
plt.figure(figsize=(15, 5))
plt.subplot(1, 3, 1)
sns.boxplot(data=df_22, x="Pos", y="pts", palette="Blues")
plt.title("2022-23: Position vs PTS")
plt.subplot(1, 3, 2)
sns.boxplot(data=df_22, x="Pos", y="reb", palette="Greens")
plt.title("2022-23: Position vs REB")
plt.subplot(1, 3, 3)
sns.boxplot(data=df_22, x="Pos", y="ast", palette="Reds")
plt.title("2022-23: Position vs AST")
plt.tight_layout()
plt.show()
C:\Users\27508\AppData\Local\Temp\ipykernel_23776\2990118663.py:6: FutureWarning:

Passing `palette` without assigning `hue` is deprecated and will be removed in v0.14.0. Assign the `x` variable to `hue` and set `legend=False` for the same effect.

  sns.boxplot(data=df_19, x="Pos", y="pts", palette="Blues")
C:\Users\27508\AppData\Local\Temp\ipykernel_23776\2990118663.py:9: FutureWarning:

Passing `palette` without assigning `hue` is deprecated and will be removed in v0.14.0. Assign the `x` variable to `hue` and set `legend=False` for the same effect.

  sns.boxplot(data=df_19, x="Pos", y="reb", palette="Greens")
C:\Users\27508\AppData\Local\Temp\ipykernel_23776\2990118663.py:12: FutureWarning:

Passing `palette` without assigning `hue` is deprecated and will be removed in v0.14.0. Assign the `x` variable to `hue` and set `legend=False` for the same effect.

  sns.boxplot(data=df_19, x="Pos", y="ast", palette="Reds")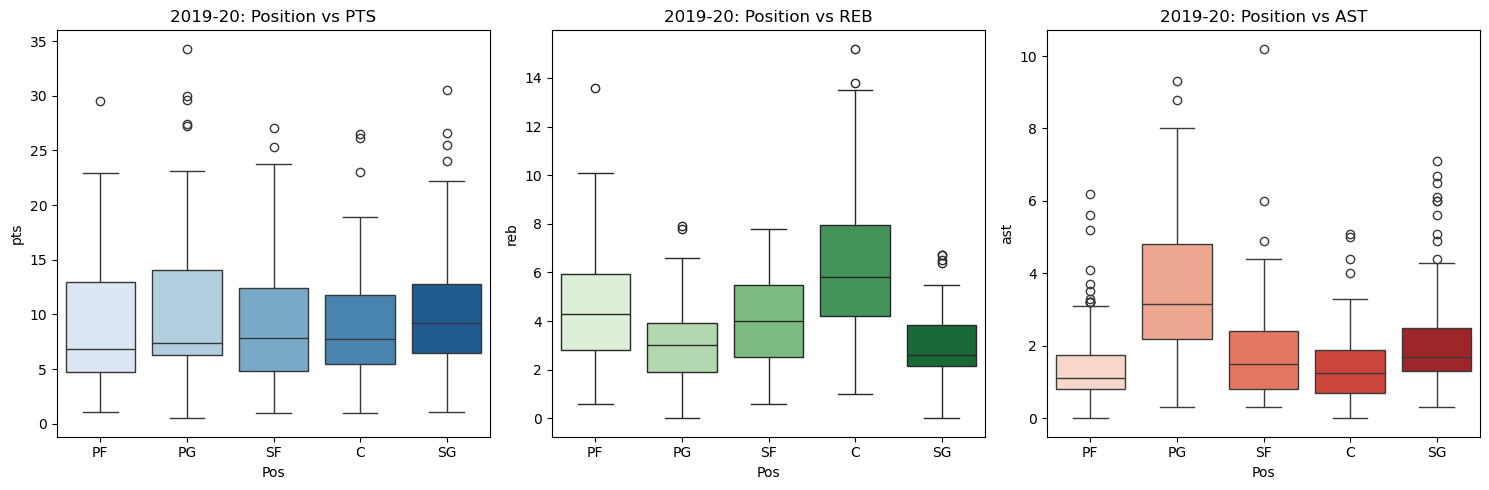
C:\Users\27508\AppData\Local\Temp\ipykernel_23776\2990118663.py:20: FutureWarning:

Passing `palette` without assigning `hue` is deprecated and will be removed in v0.14.0. Assign the `x` variable to `hue` and set `legend=False` for the same effect.

  sns.boxplot(data=df_20, x="Pos", y="pts", palette="Blues")
C:\Users\27508\AppData\Local\Temp\ipykernel_23776\2990118663.py:23: FutureWarning:

Passing `palette` without assigning `hue` is deprecated and will be removed in v0.14.0. Assign the `x` variable to `hue` and set `legend=False` for the same effect.

  sns.boxplot(data=df_20, x="Pos", y="reb", palette="Greens")
C:\Users\27508\AppData\Local\Temp\ipykernel_23776\2990118663.py:26: FutureWarning:

Passing `palette` without assigning `hue` is deprecated and will be removed in v0.14.0. Assign the `x` variable to `hue` and set `legend=False` for the same effect.

  sns.boxplot(data=df_20, x="Pos", y="ast", palette="Reds")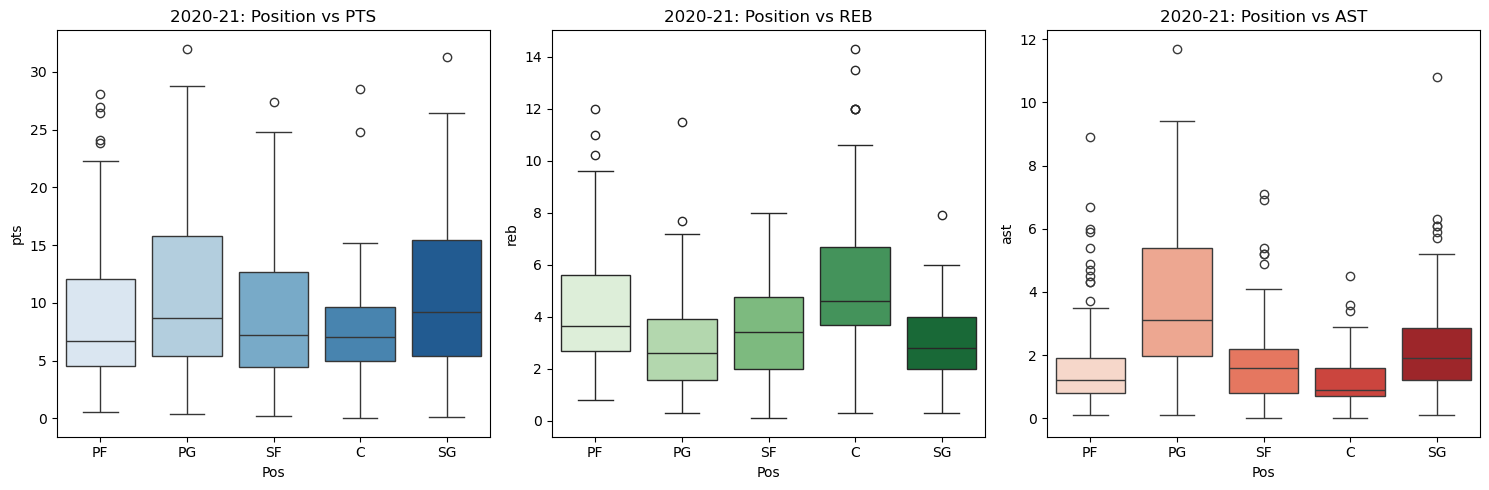
C:\Users\27508\AppData\Local\Temp\ipykernel_23776\2990118663.py:34: FutureWarning:

Passing `palette` without assigning `hue` is deprecated and will be removed in v0.14.0. Assign the `x` variable to `hue` and set `legend=False` for the same effect.

  sns.boxplot(data=df_21, x="Pos", y="pts", palette="Blues")
C:\Users\27508\AppData\Local\Temp\ipykernel_23776\2990118663.py:37: FutureWarning:

Passing `palette` without assigning `hue` is deprecated and will be removed in v0.14.0. Assign the `x` variable to `hue` and set `legend=False` for the same effect.

  sns.boxplot(data=df_21, x="Pos", y="reb", palette="Greens")
C:\Users\27508\AppData\Local\Temp\ipykernel_23776\2990118663.py:40: FutureWarning:

Passing `palette` without assigning `hue` is deprecated and will be removed in v0.14.0. Assign the `x` variable to `hue` and set `legend=False` for the same effect.

  sns.boxplot(data=df_21, x="Pos", y="ast", palette="Reds")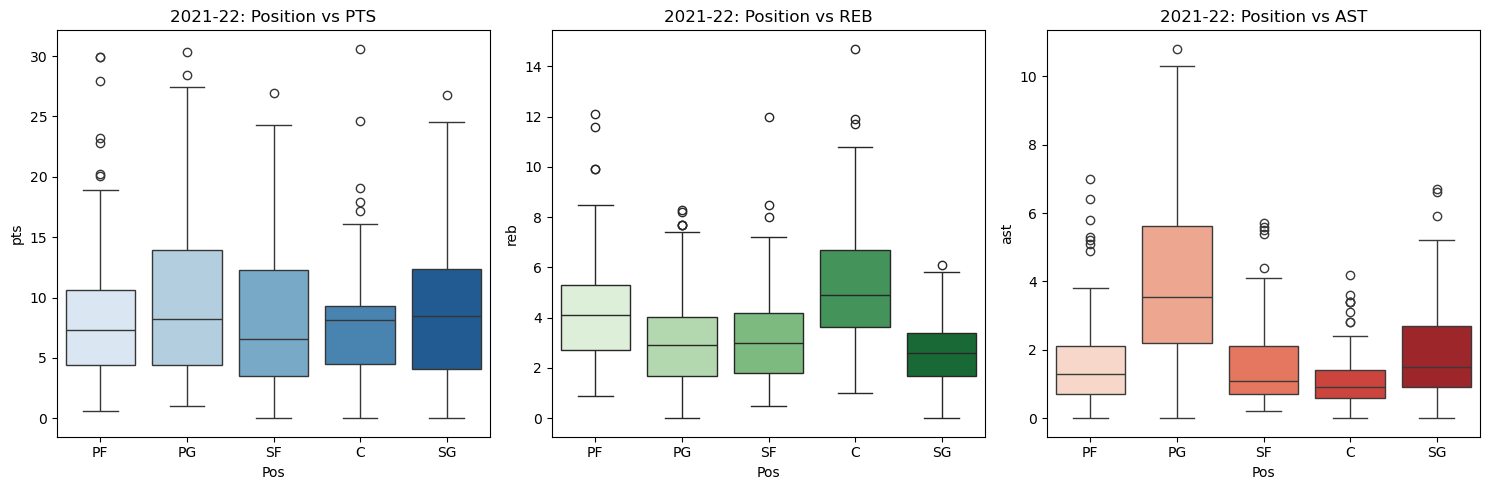
C:\Users\27508\AppData\Local\Temp\ipykernel_23776\2990118663.py:48: FutureWarning:

Passing `palette` without assigning `hue` is deprecated and will be removed in v0.14.0. Assign the `x` variable to `hue` and set `legend=False` for the same effect.

  sns.boxplot(data=df_22, x="Pos", y="pts", palette="Blues")
C:\Users\27508\AppData\Local\Temp\ipykernel_23776\2990118663.py:51: FutureWarning:

Passing `palette` without assigning `hue` is deprecated and will be removed in v0.14.0. Assign the `x` variable to `hue` and set `legend=False` for the same effect.

  sns.boxplot(data=df_22, x="Pos", y="reb", palette="Greens")
C:\Users\27508\AppData\Local\Temp\ipykernel_23776\2990118663.py:54: FutureWarning:

Passing `palette` without assigning `hue` is deprecated and will be removed in v0.14.0. Assign the `x` variable to `hue` and set `legend=False` for the same effect.

  sns.boxplot(data=df_22, x="Pos", y="ast", palette="Reds")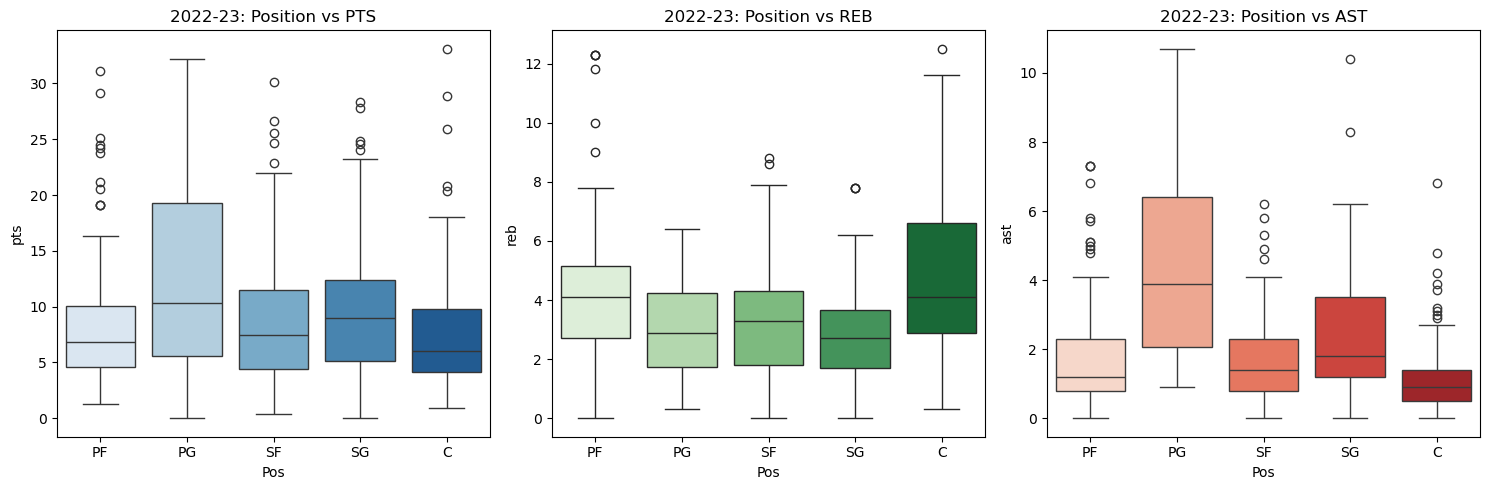
# Bar plots: Average Salary by Position

# 2019
plt.figure(figsize=(10, 6))
sns.barplot(data=df_19, x="Pos", y="season.y", palette="coolwarm")
plt.title("2019-20: Average Salary by Position")
plt.ylabel("Average Salary")
plt.xlabel("Position")
plt.grid(True)
plt.show()

# 2020
plt.figure(figsize=(10, 6))
sns.barplot(data=df_20, x="Pos", y="2020/21", palette="coolwarm")
plt.title("2020-21: Average Salary by Position")
plt.ylabel("Average Salary")
plt.xlabel("Position")
plt.grid(True)
plt.show()

# 2021
plt.figure(figsize=(10, 6))
sns.barplot(data=df_21, x="Pos", y="2021/22", palette="coolwarm")
plt.title("2021-22: Average Salary by Position")
plt.ylabel("Average Salary")
plt.xlabel("Position")
plt.grid(True)
plt.show()

# 2022
plt.figure(figsize=(10, 6))
sns.barplot(data=df_22, x="Pos", y="2022/23", palette="coolwarm")
plt.title("2022-23: Average Salary by Position")
plt.ylabel("Average Salary")
plt.xlabel("Position")
plt.grid(True)
plt.show()
C:\Users\27508\AppData\Local\Temp\ipykernel_23776\2563337894.py:5: FutureWarning:
Passing `palette` without assigning `hue` is deprecated and will be removed in v0.14.0. Assign the `x` variable to `hue` and set `legend=False` for the same effect.
sns.barplot(data=df_19, x="Pos", y="season.y", palette="coolwarm")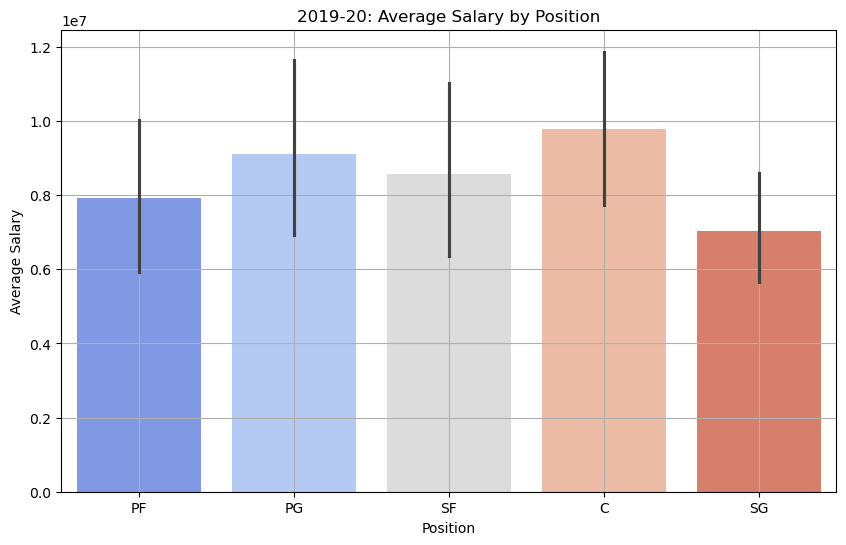
C:\Users\27508\AppData\Local\Temp\ipykernel_23776\2563337894.py:14: FutureWarning:

Passing `palette` without assigning `hue` is deprecated and will be removed in v0.14.0. Assign the `x` variable to `hue` and set `legend=False` for the same effect.

  sns.barplot(data=df_20, x="Pos", y="2020/21", palette="coolwarm")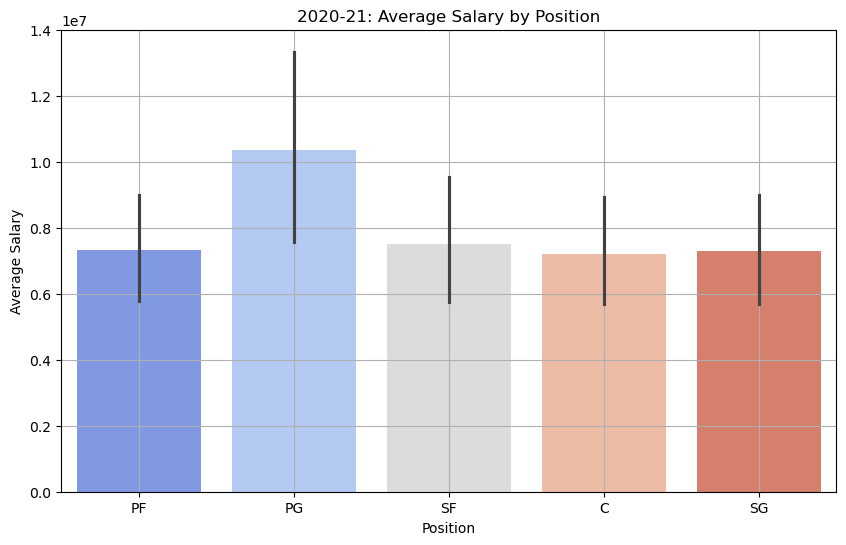
C:\Users\27508\AppData\Local\Temp\ipykernel_23776\2563337894.py:23: FutureWarning:

Passing `palette` without assigning `hue` is deprecated and will be removed in v0.14.0. Assign the `x` variable to `hue` and set `legend=False` for the same effect.

  sns.barplot(data=df_21, x="Pos", y="2021/22", palette="coolwarm")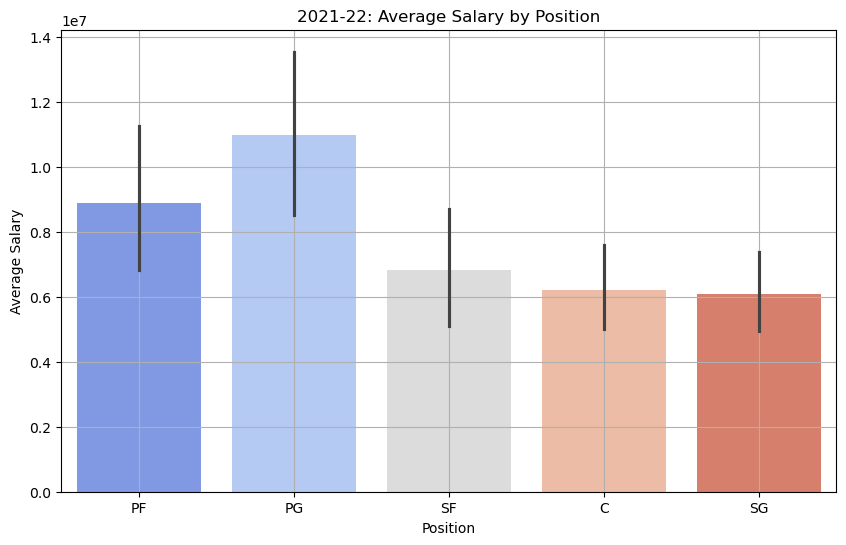
C:\Users\27508\AppData\Local\Temp\ipykernel_23776\2563337894.py:32: FutureWarning:

Passing `palette` without assigning `hue` is deprecated and will be removed in v0.14.0. Assign the `x` variable to `hue` and set `legend=False` for the same effect.

  sns.barplot(data=df_22, x="Pos", y="2022/23", palette="coolwarm")